- تحليلات
- التحليل الفني للسوق
التحليل الفني - التداول: 2015-07-14
Probable escape from sideways trend
We would like to present you the TRY/JPY Personal composite instrument (PCI), which reflects the Turkish lira price dynamics in relation to the Japanese yen. The instrument may grow due to particular qualities of the Japanese and Turkish economies. The bank rate in Turkey is 7.5%, while 10-year government bonds have the coupon of 9.15%.This is far higher than the Japanese rate of 0% and the coupon of 0.46%. Higher bank rates may strengthen the Turkish lira. In the first quarter the GDP in Turkey increased 2.3%, while in Japan it added 1%. The debt/GDP ratio in Turkey equals 40% and Japan has the ratio of 223%. Meanwhile, Bank of Japan continues money emission, which may be compared to the American quantitative easing program. Sure enough, inflation in Turkey in July was 7.2% (y-o-y), leaving far behind consumer prices growth in Japan (0.5%). It makes the lira slightly less attractive. However, consumer prices in July dropped 0.51% q-o-q. We suppose it may result in inflation slowdown. Next morning Bank of Japan Chair Haruhiko Kuroda will hold a press-conference, which may affect the Japanese yen. Trade Balance in June will be released in Turkey July, 31. The construction of the “Turkish stream” pipe line may produce additional support to the Turkish economy. The route will provide Eastern Europe and Austria with Russian gas.
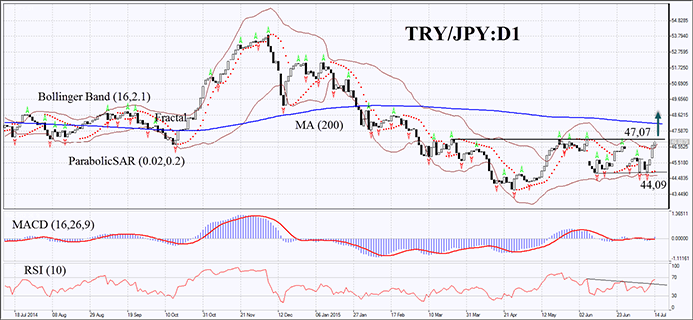
On the daily chart the TRY/JPY PCI reached the top of the range. It crossed the upper Bollinger band and four latest fractal highs. The MACD indicator is located above the signal and the zero lines, giving buy signals. Yet, it is rather weak due to small amplitude. Parabolic SAR has shaped bullish signals. Bollinger Bands have started expanding and have a positive slope, indicating volatility growth and trend strengthening. RSI-Bars have been moving up but has not yet reached the overbought zone. The bullish momentum may develop if the price breaches the side range upper boundary at 47.07—a buy pending order may be placed there. A stop loss may be placed above two latest fractal lows and the Parabolic signal at 44.9. After pending order activation the stop loss is supposed to be moved every four hours near the next fractal low, following Bollinger and Parabolic signals. The most cautious traders may switch to the H4 time frame and place a stop loss, moving it after the trend. Thus, we are changing the probable profit/loss ratio to the breakeven point. If the price reaches the stop loss without triggering the order we recommend to cancel the position: the market sustains internal changes that were not considered.
| Position | Buy |
| Buy stop | above 47,07 |
| Stop loss | below 44,9 |
- الحصول على الشهادة

:تنبيه
يحمل هذا الموجز طابعاً إعلامياً و تعليمياً و تنشر بالمجان . تأتي معظم البيانات المدرجة في الموجز من المصادر العامة معترفة أكثر و أقل موثوقية . مع ذلك ، لا يوجد تأكيد على أن المعلومات المشارة إليها كاملة و دقيقة . لا يتم تحديث الموجز . معظم المعلومات في كل موجز ، تتضمن الرأي و المؤشرات و الرسوم البيانية و أي شيئ اخر وتقدم فقط لأغراض التعريف وليس المشورة المالية أو توصية . لا يمكن اعتبار النص باكماله أو أي جزء منه و أيضاً الرسوم البيانية كعرض لقيام بصفقة بأي اداة . آي إف سي ماركيتس وموظفيها ليست مسؤولة تحت أي ظرف من الظروف عن أي إجراء يتم اتخاذه من قبل شخص آخر أثناء أو بعد قراءة نظرة عامة .
