- تحليلات
- التحليل الفني للسوق
الصويا التحليل الفني - الصويا التداول: 2016-05-23
Higher soy prices in sowing season may lead to higher soy planting acreage
Soy prices hit a fresh high since July 2014 and continue to rule high. Some market participants believe the US farmers may increase soy sowings by reducing corn planting acreage. Soy prices have been rising for the recent 12 weeks already. Will they correct down?
In its March report USDA expected the soy planting acreage to fall 1% to 82.24mln acres this spring compared to the last year while corn acreage to rise by 6% to 93.6mln. Since then soy prices soared 18% while corn gained only 6%. If the soy planting acreage is to rise amid higher prices this may trigger the downward correction. Farmers have seeded 38% of soy so far and the more precise data are yet to come. The independent agricultural agencies believe the soy planting acreage in US is to be of 83mln acres. Another negative factor is the lower production of soybean oil in US. The US National Oilseed Processors Association reports 147.7mln soy bushels were crushed into oil in April which is below the March reading of 156.69mln bushels. The soy export fell in April to 769 tonnes from 779 tonnes in March and 799 tonnes in April 2015.
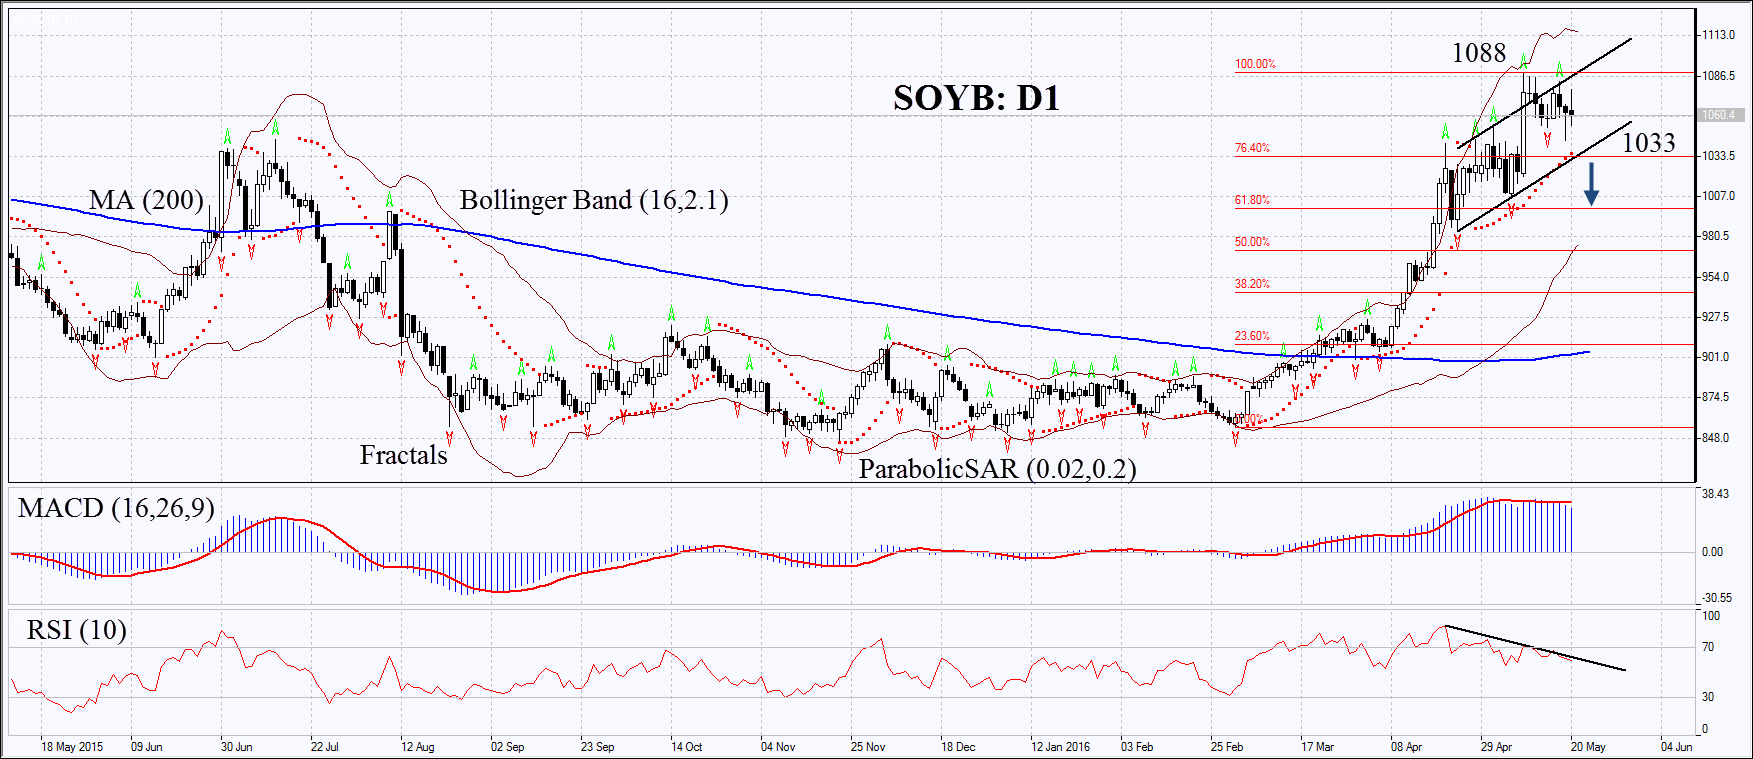
On the daily chart Soyb: D1 is in the rising channel and is correcting towards its lower boundary. The MACD is giving signals to sell. The Parabolic has not reversed down yet. RSI has formed negative divergence. The Bollinger bands have widened a lot which means higher volatility. The bearish momentum may develop in case the soy prices fall below the last fractal low, the 1st Fibonacci retracement and the upper boundary of the rising channel at 1033. This level may serve the point of entry. The initial stop-loss may be placed above the high since July 2014 and the two last fractal highs at 1088. Having opened the pending order we shall move the stop to the next fractal high following the Parabolic and Bollinger signals. Thus, we are changing the probable profit/loss ratio to the breakeven point. The most risk-averse traders may switch to the 4-hour chart after the trade and place there a stop-loss moving it in the direction of the trade. If the price meets the stop-loss level at 1088 without reaching the order at 1033, we recommend cancelling the position: the market sustains internal changes which were not taken into account.
| Position | Sell |
| Sell stop | below 1033 |
| Stop loss | above 1088 |
- الحصول على الشهادة

:تنبيه
يحمل هذا الموجز طابعاً إعلامياً و تعليمياً و تنشر بالمجان . تأتي معظم البيانات المدرجة في الموجز من المصادر العامة معترفة أكثر و أقل موثوقية . مع ذلك ، لا يوجد تأكيد على أن المعلومات المشارة إليها كاملة و دقيقة . لا يتم تحديث الموجز . معظم المعلومات في كل موجز ، تتضمن الرأي و المؤشرات و الرسوم البيانية و أي شيئ اخر وتقدم فقط لأغراض التعريف وليس المشورة المالية أو توصية . لا يمكن اعتبار النص باكماله أو أي جزء منه و أيضاً الرسوم البيانية كعرض لقيام بصفقة بأي اداة . آي إف سي ماركيتس وموظفيها ليست مسؤولة تحت أي ظرف من الظروف عن أي إجراء يتم اتخاذه من قبل شخص آخر أثناء أو بعد قراءة نظرة عامة .
