- تحليلات
- التحليل الفني للسوق
USD/CAD التحليل الفني - USD/CAD التداول: 2016-05-17
Canada wildfire may weaken national currency
Canadian dollar fell in mid-January 2016 to the lowest in 11-years against the US dollar. On the USDCAD chart it looks as growth. After that it started to strengthen together with global oil prices. In the beginning of May the trend reversed amid sharp decline in oil production in Canada due to wildfires and weak economic data from China which is the main importer of Canadian oil. Will the Canadian dollar continue weakening?
Wild fires in Canada spread to 241 thousand hectares and caused around 1mln barrels a day oil production cuts. As a result, Canada’s GDP outlook in Q2 2016 may be revised down. The data for Q1 are due on May 31. This weekend the industrial production data came out for April – the indicator rose only 6% instead of the expected 6.5% growth. At the same time the China’s retail sales for April came out with 10.1% increase year on year which is below their expected rise of 10.5%. The Chinese economic slowdown may take its tall on Canadian exports. This week the most significant economic data will come out on Friday: the retail sales for March and inflation for April. We see their tentative outlook as negative.
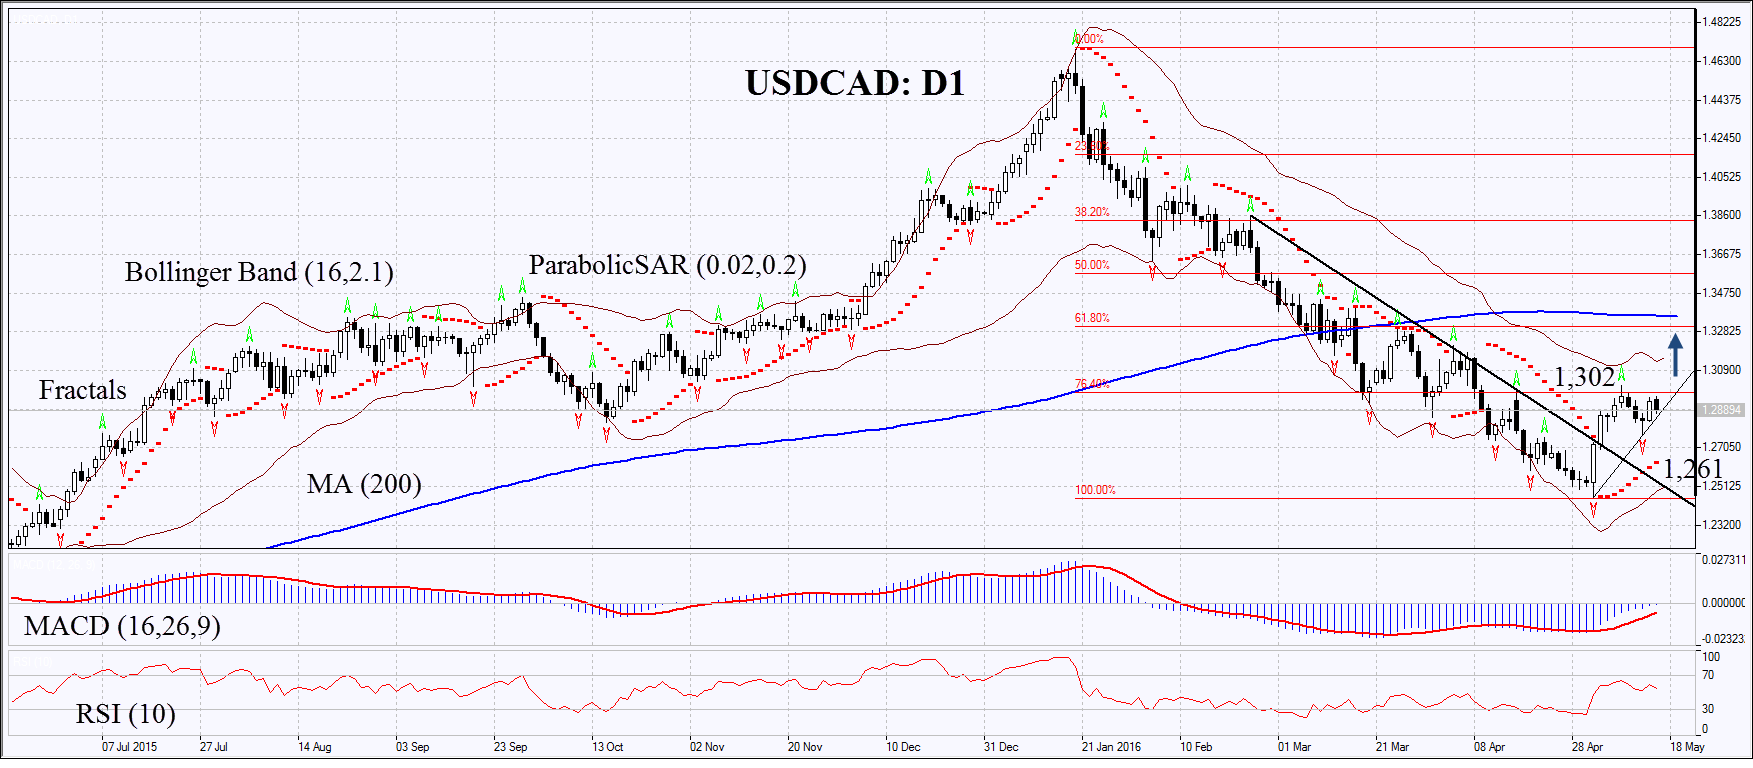
On the daily chart USDCAD: D1 has left the downtrend to correct upwards. It has reached the 1st Fibonacci retracement but failed to surpass it. The MACD and Parabolic give signals to buy. RSI is above 50, no divergence. The Bollinger bands have contracted which means lower volatility. They are tilted upwards. The bullish momentum may develop in case the Canadian dollar surpasses the last fractal high and the 1st Fibonacci retracement at 1.302. This level may serve the point of entry. The initial risk-limit may be placed below the Parabolic signal and the last fractal low at 1.261. Having opened the pending order we shall move the stop to the next fractal low following the Parabolic and Bollinger signals. Thus, we are changing the probable profit/loss ratio to the breakeven point. The most risk-averse traders may switch to the 4-hour chart after the trade and place there a stop-loss moving it in the direction of the trade. If the price meets the stop-loss level at 1.261 without reaching the order at 1.302, we recommend cancelling the position: the market sustains internal changes which were not taken into account.
| Position | Buy |
| Buy stop | above 1.302 |
| Stop loss | below 1.261 |
- الحصول على الشهادة

:تنبيه
يحمل هذا الموجز طابعاً إعلامياً و تعليمياً و تنشر بالمجان . تأتي معظم البيانات المدرجة في الموجز من المصادر العامة معترفة أكثر و أقل موثوقية . مع ذلك ، لا يوجد تأكيد على أن المعلومات المشارة إليها كاملة و دقيقة . لا يتم تحديث الموجز . معظم المعلومات في كل موجز ، تتضمن الرأي و المؤشرات و الرسوم البيانية و أي شيئ اخر وتقدم فقط لأغراض التعريف وليس المشورة المالية أو توصية . لا يمكن اعتبار النص باكماله أو أي جزء منه و أيضاً الرسوم البيانية كعرض لقيام بصفقة بأي اداة . آي إف سي ماركيتس وموظفيها ليست مسؤولة تحت أي ظرف من الظروف عن أي إجراء يتم اتخاذه من قبل شخص آخر أثناء أو بعد قراءة نظرة عامة .
